
| Synchrotrons are simply just very powerful x-ray sources, which can be used for a wide variety of different scientific applications. Working with beamline scientist Jakub Drnec at the ESRF Synchrotron in Grenoble we developed an approach to use synchrotron based x-rays to analyze full CO2 electrolyzers during operation. ESRF is one of the most powerful synchrotrons in the world as it can produce quite high energy x-rays at a high rate. Using 70 keV photons allows us to easily penetrate through our entire 1cm CO2 electrolyzer. An important key to this is that we use a plastic (PEEK) cell encasing and graphite based flow fields and gas diffusion layers with only a small amount of metal catalysts. Thus most of these materials are not strong x-ray absorbing materials allowing most x-rays to pass. However enough x-rays are scattered to allow us to analyze what is in the electrolyzer and if it is changing as we vary operating conditions. It is incredibly hard to see what is going on within a CO2 electrolyer while it is operating, thus typically modeling and indirect experiments are done to analyse this. However this synchrotron approach allows us to see this operando providing clear insights into the science and engineering properties of these electrolyzers. |
 |
| The European Research Synchrotron Facility (ESRF) in Grenoble France |
|
Process of getting synchrotron results The picture on the right shows the actual electrolyzer that we use. The length of it is approximately the size of an index figure. It consists of both the anode and cathode flow fields and the actual membrane electrode assembly (MEA) electrolyzer goes in the middle. The last figure on the right is a dumbell 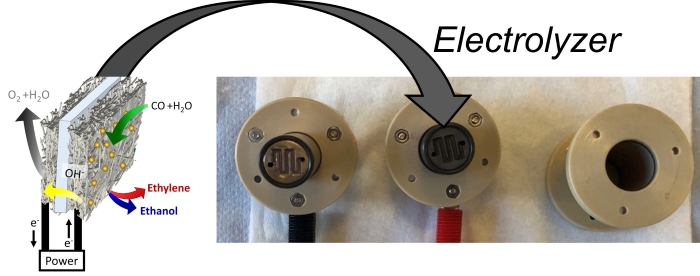 shaped figue that
encompasses both the flow fields and the MEA
ensuring no gas leakage throughout the sides. shaped figue that
encompasses both the flow fields and the MEA
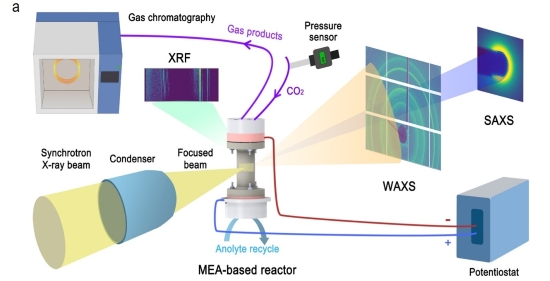
ensuring no gas leakage throughout the sides.This set-up is then taken to the synchrotron where we operate CO2 electrolysis while irradiating it with x-rays as shown in the image below. This produces x-ray scattering images, which we then equate to intensity at a function of inverse distance (i.e q-space)from the center. |
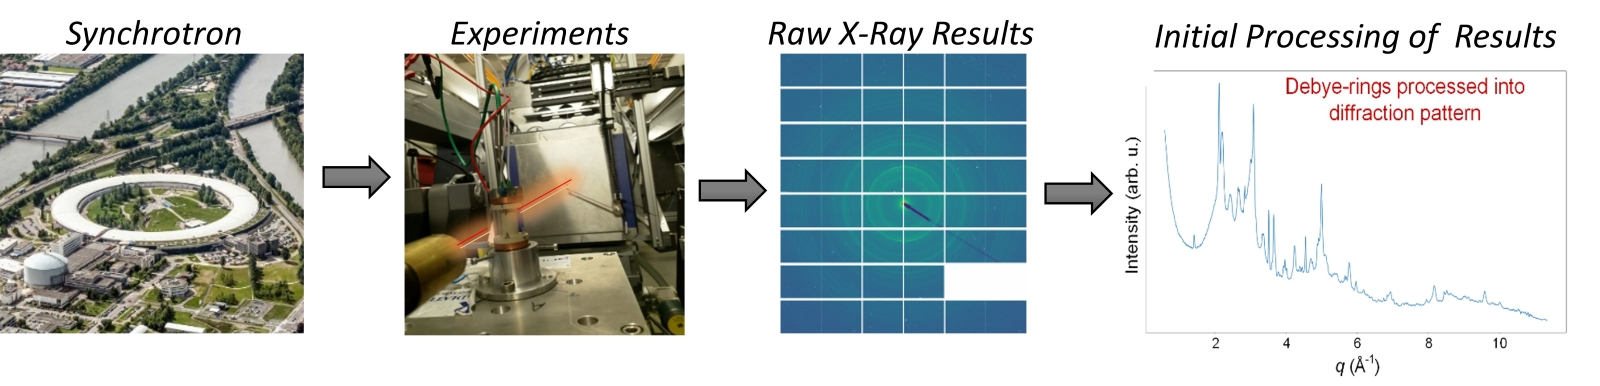
These x-ray needs about 2 seconds to get sufficient data to get a good signal to noise ratio. As most processes that we are interested in takes place on the minutes or hours time scale, this gives us substantial flexibility. We take advantage of this by scanning across the MEA allowing us to analyze the anode, cathode and membrane. Since the x-ray beam is 5 um and our MEA is about 500 um thick, this gives us lots of points to probe throughout the device. We typically take about 3 minutes to scan throughout the entire device giving us substantial amount of spots within the MEA to analyze. As our experiments typically operate for 3-4 hours, we can see how all these areas change with time (at a time resolution of 3 minutes). While this is great scientifically, in terms of data analysis this is a mess because we produce about 10,000 x-ray diffraction patterns every experiment.
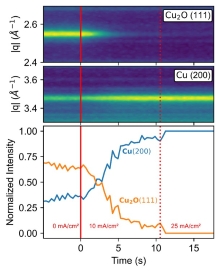 From Moss et. al, Joule 2023 |
One simple
result we can get from this is analyzing what
oxidation state our catalyst is in. Both Cu
and the oxidized Cu (Cu2O)
will scatter the x-rays differently, resulting in
peaks at different q-sapce. Thus we monitored
our catalystsat the beginning of our electrolysis
experiment. The catalysts were initially
copper particles, but since they were out in air
their surface was a bit oxidized. Thus before
the test we saw both Cu and Cu2O.
However immdediately after testing we only saw Cu,
which tells us that this is the active material for
CO2
electrolysis. While CO2 electrolysis should only have CO2 gas on the cathode, researchers hypothesized that water was coming across from the anode side, and this aqueous electrolyte was creating a mass transfer barrier for CO2 to get to the cathode (resulting in low value H2 evolution). Unlike Cu water is not crystalline and does not have sharp x-ray peaks. However like most materials water scatters x-rays and this occurs over all q-space. Effectively water will provide a background signal when looking at different q-space. Variations in water will result in variations in our background signal, thus if we analyze a place where there is no peaks and just a change in background, we can effectively monitor water. |
| The figure to the right shows us monitoring the
change in background. We do this both as the
x-ray is scanning up and down accross the MEA device
and as a function of time. We developed a
computer program/algorithm that allows us to take
the background scattering of each point and then
give it a value, which shows up as a given color on
a heat map. The computer algorithm is
essential give the figure to the right is just the
background peaks of about 10,000 x-ray patterns. Because there is so much data, we are bound to miss some interesting science. However one clear piece of evidence that we can see is that everytime we have a fluctuation in our water this resulted in a fluctuation in our cell voltage (we operated at a constant current). This obviously indicates these are correlated. The microporous layer has a hydrophobic layer, and this is clear from this figure as there is never much water in this layer. We can also analyze salt deposition by the x-ray peaks from the salt. We always bring a gas chromatograph to the synchrotron with us so we also can relate product variations to the change in water variation. Thus by putting all these pieces of information together we can get a total understanding of what is going on. |
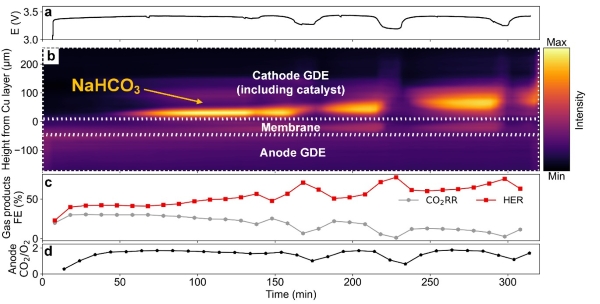 From Garg et al. E&ES, 2023 |
As scientists we are always looking to develop this further and more recently we have built on our wide angle scattering to also look at small angle scattering as this give us different information. We also realized that we could use x-ray fluorscence to watch cations move as we applied an electric field between our cathode and anode. Currently we are both analyzing our previous data as well as developing even more crazy ways to analyze our devices and systems. It is a lot of fun, but it is also a lot of work. I have been fortunate enough to have a line of absolutely amazing PhD and postdocs that have built some really deep know how into how to make all this work. |
 From Xu et al. 2025 |